


Let’s begin by answering two fundamental questions:
Q1. Why does an organization collect data?
A1. An organization collects data to enable teams to derive insights that further enable them to make decisions and run experiments to get more people to buy and use their products or services.
Q2. Why does an organization exist?
A2. An organization exists to get more people to buy and use their products or services to increase revenue or impact, or in other words, to drive growth for the business.
Therefore, an organization collects data to meet its primary objective of driving growth, an all-encompassing term for any measurable outcome that’s good for an organization – more revenue, more efficiency, more profit or impact, higher retention, higher customer satisfaction, and so on.
Data and Good Outcomes
Decision-making and experimentation are activities rather than outcomes; teams need good data to perform these activities and in doing so, hope to improve the end-user/customer experience.
This brings me to a critical fact that often gets overlooked and must be highlighted:
“Making a decision or running an experiment doesn’t necessarily lead to a better customer experience and in fact, can potentially even degrade the experience.”
To find out whether the impact of decisions and experiments on the customer experience is good, bad, or neutral, one has to measure the respective outcomes of those activities.
Measuring outcomes results in much-needed insights and helps teams understand whether or not their data-powered experiments and decisions lead to any type of positive growth.
On the other hand, focusing solely on the activities and ignoring the outcomes is one of the primary reasons organizations are unable to turn data into measurable and sustainable growth.
But turning data into growth is easier said than done – I know, I’ve been there, and maybe you have too.
The Big, Data Problem
Today, there’s more than one tool available to solve every little data problem that exists; there’s absolutely no paucity of tools.
But turning data into growth is a big problem – a problem that tools alone cannot solve. I call this a “big” problem because:
- The end-to-end process (of turning data into growth) involves several steps or components
- Each component leads to an output that becomes the input for the components that come next
- The paths between components aren’t necessarily linear or uniform due to external dependencies
However, even though the process of turning data into growth can be long and complex, it doesn’t have to be complicated; all it requires is the right environment, a mix of tools and training, and a lot of motivation. If you think about it, training for a marathon has similar requirements – it’s not easy, it’s not quick, but it’s also not complicated.
This got me wondering – if it’s not so complicated, why do a majority of organizations that have access to the best tools and talent struggle to derive ROI from their data initiatives? In other words, why do savvy organizations fail to turn data into growth?
Since the answer is so subjective, I figured it made more sense to turn this problem on its head and try to answer the following question:
What do savvy organizations need to do in order to turn data into growth?
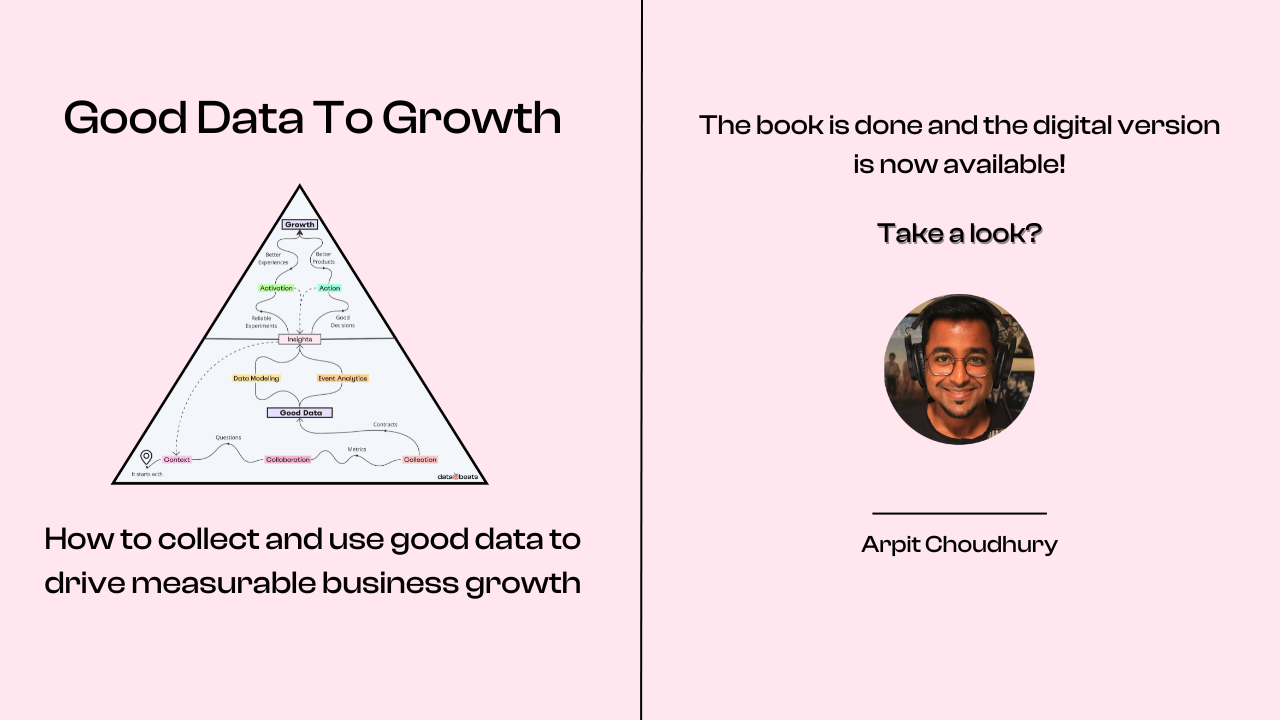
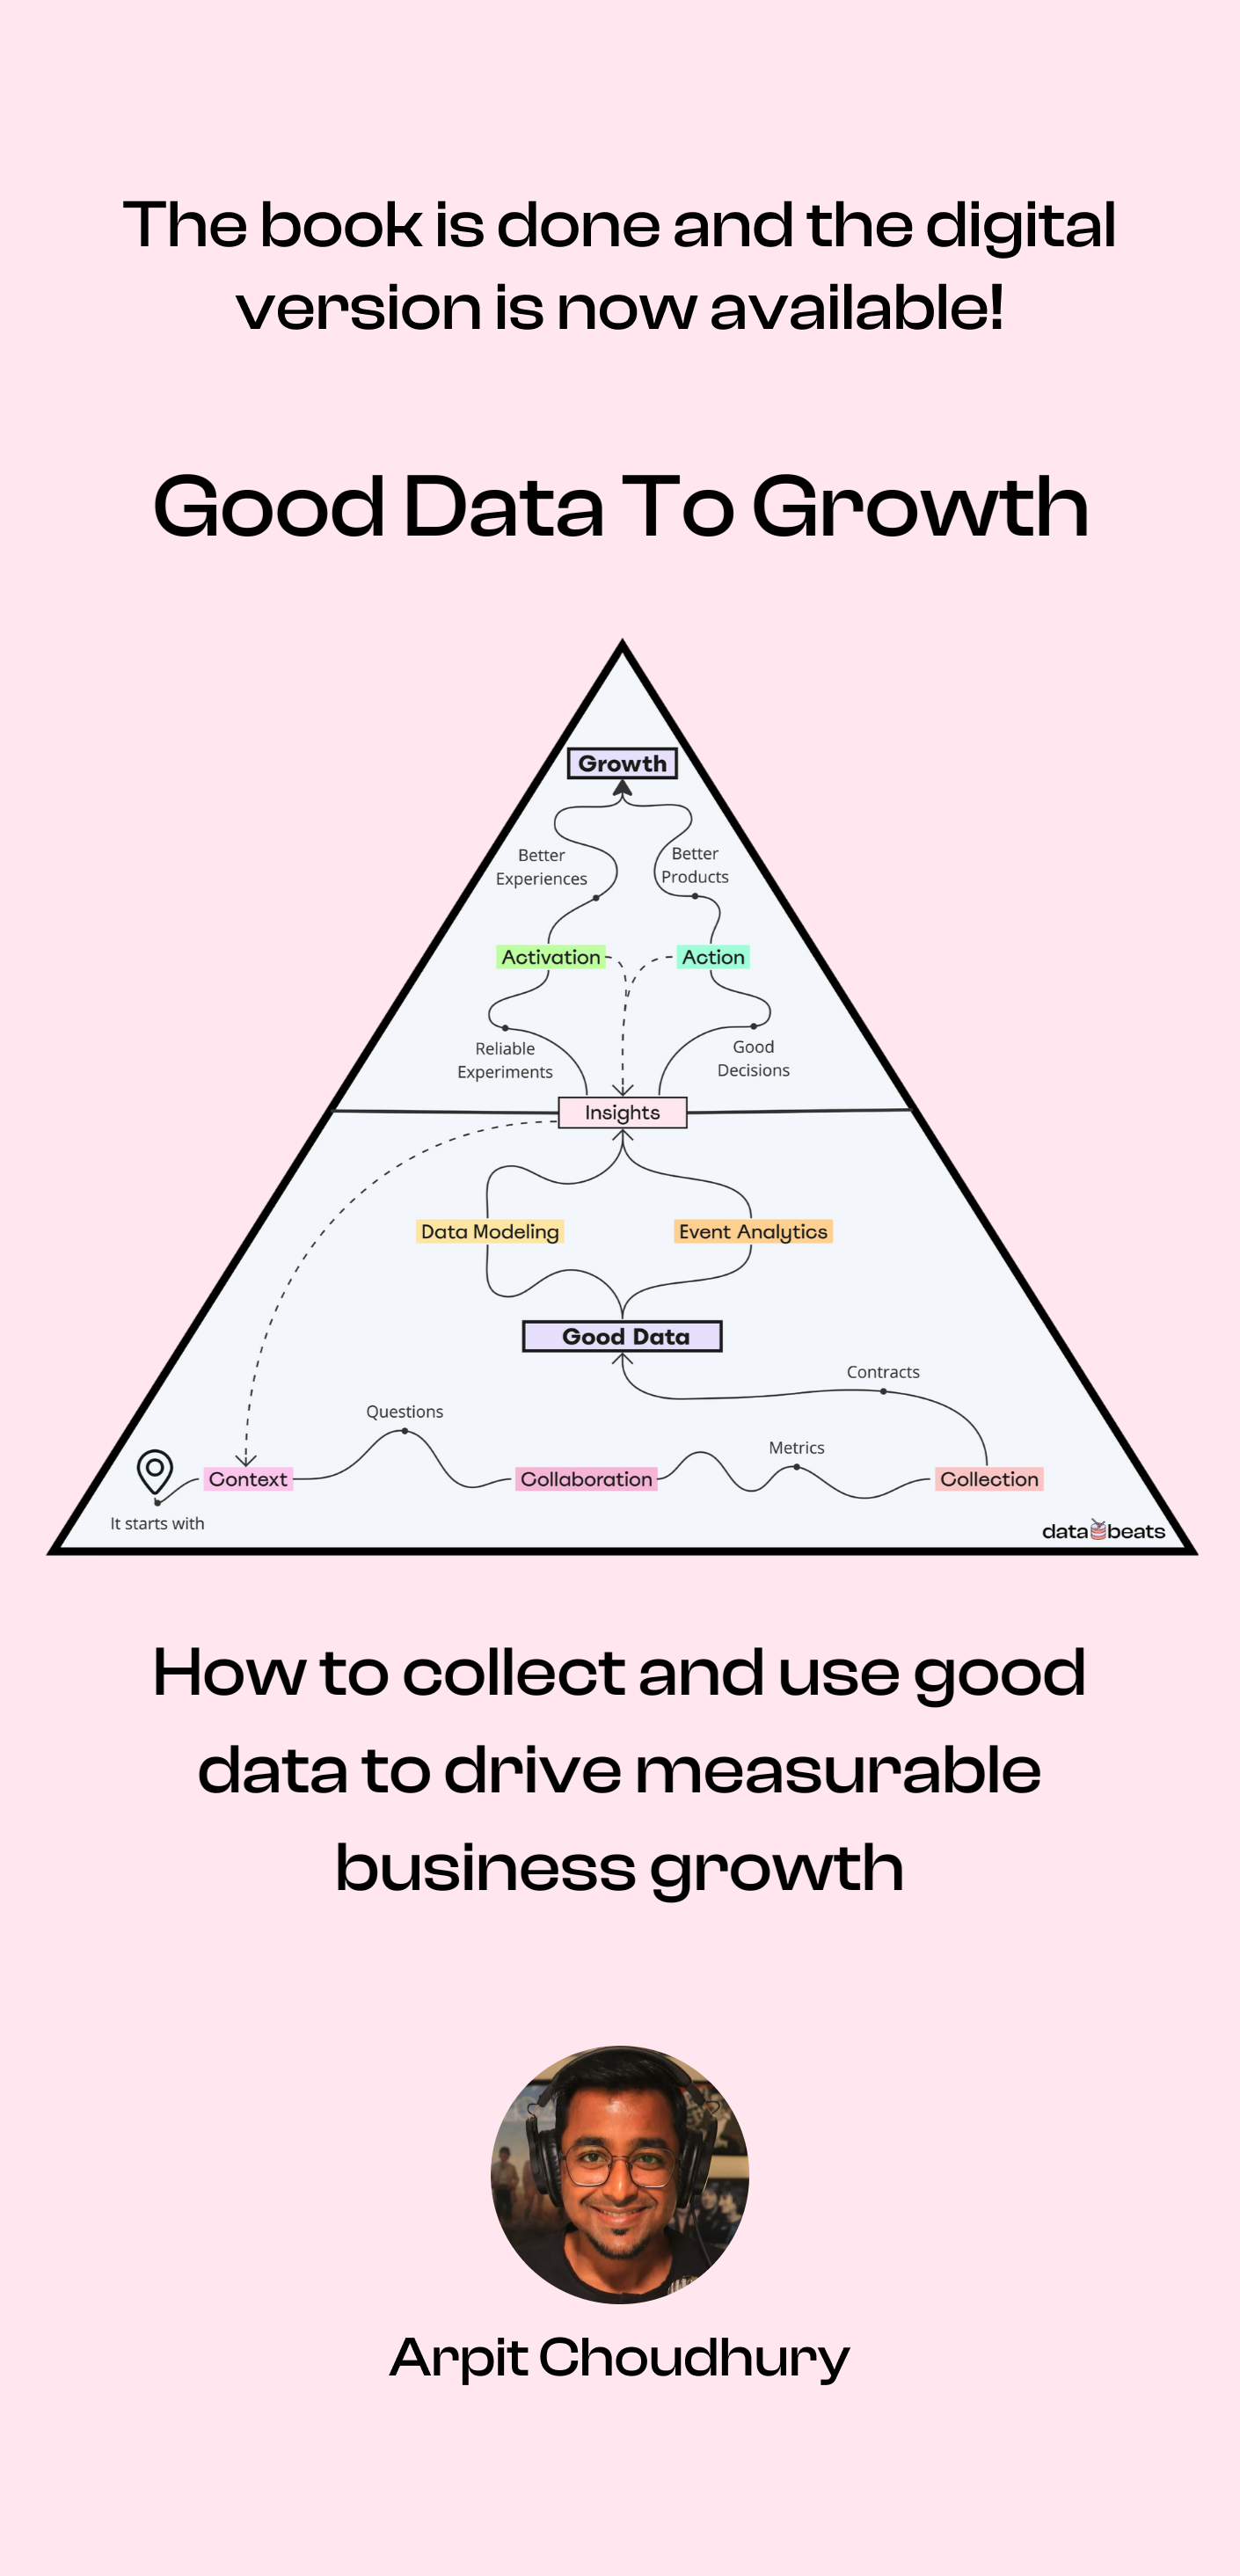
Introducing The GDG Model
GDG stands for Good Data to Growth. I don’t consider this a framework; instead, I think of it as a model that organizations can adapt to fit their needs and priorities. They can skip certain components or introduce their own as long as the goal is to drive data-powered growth.

What you see above is not the complete model but only its core components.
Before depicting the various paths connecting the components, I’d like to highlight that the GDG model does not apply to the following types of organizations:
- Organizations that rely on other methods to drive growth (such as lobbying)
- Organizations that collect data for reasons other than driving growth (I can only think of herd mentality or situations where pleasing the higher-ups is the only priority).
- Organizations that are in the business of selling data (where the primary objective is to collect as much data as possible)
On the other hand, if driving growth using data (data-powered growth) is a priority for an organization, the first step is to lay a foundation for Good Data. Let’s explore this further in reference to the GDG model.
The Path To Good Data
The GDG model is suitable not only for organizations starting their data journey from scratch but also for those that already have a mature data practice. After all, data collection is an iterative, ongoing activity.

What follows is an explanation of the components that together, can help lay a foundation for Good Data.
Context and Questions
It starts with some context from the growth team – an insight, hypothesis, intuition, or the desire to know the unknown. When data is collected without context, the quality suffers and the likelihood of that data being used is quite low.
Example: We’re acquiring almost a thousand new users every day but only a tiny percentage of new users are hitting the activation milestone. We need to identify the points of friction and figure out how to improve our activation rate.
Context leads to questions to derive more insights or to prove a hypothesis or intuition.
Example: Is our onboarding process too long? Is our product too complicated to use? Are we even acquiring the right people?
Collaboration and Metrics
Then it’s time to collaborate with the data team to discuss what data is already available and what needs to be collected to get some answers. The data team must thoroughly understand the context and the questions to collect and deliver precisely the data that’s needed for the growth team to get some answers.
Additionally, whenever feasible, it’s helpful to define a metric – such as activation rate – that will help communicate and present the answers. Defining metrics upfront often leads to more questions; the sooner those questions come up, the more robust the data collection process is.
Example: Our activation milestone is a user creating at least one report and inviting at least one team member to the account. Therefore, to calculate the activation rate, besides the number of reports created, we also need to know whether an invitation has been sent or not.
Collection and Contracts
Finally, it’s time for the data team to initiate collection. However, since the engineering team maintains the product features and the data team sets up pipelines to collect data from the usage of those features, the two teams must always be in sync. This is where data contracts come into play because the tiniest change by engineering can break the data pipeline, resulting in bad data.
Example: The engineering team decides to make the user invitation process more seamless. Earlier, users could only be invited using email whereas now one can choose to share a multi-use invitation link directly via the Slack integration. Without a process or a data contract to keep the data team in the loop about this new feature, the data team wouldn’t know that they need to include it in their invitation tracking pipeline, leading to bad data.
By putting this process into production, teams can get much closer to laying a foundation for Good Data.
Now let’s look at what comes next after Good Data.
From Good Data To Insights
It doesn’t make sense to jump headfirst either into data activation or data action (more on this in the next section) without first deriving insights from the data. To drive sustainable growth, teams need to first understand the data and then understand what the data tells them about the behaviors and traits of users and customers.

Depending on the data and the type of insight, data modeling and event analytics are the two distinct activities that teams need to perform to derive insights from Good Data.
Event Analytics
Also referred to as behavioral analytics or product analytics, and sometimes even customer journey analytics or sequence analytics, event analytics helps understand user behavior by analyzing the sequence of actions (or events) users perform while interacting with a digital product.
Doing so enables growth teams to identify points of friction in the user journey and figure out which features are getting more usage and which ones are not.
I believe, among all the different terms described above, event analytics is the most straightforward, especially because it goes beyond analyzing user events or the actions performed by real humans – event analytics includes the analysis of all types of event data, including account events and system events.
Moreover, due to the availability of packaged product analytics tools that come with a bevy of pre-built reports, analyzing event data is quick and easy for the growth team once the requisite events are made available by the data team.
Data Modeling
Besides event data, there are many other types of data that companies collect from a variety of sources, particularly third-party tools that power a bulk of the end-user experiences including emails, support, in-app messaging, payments, and so on. Needless to say, there are lots of insights to be derived from the data generated by the tools and systems powering those experiences.
However, to go beyond the basic reports embedded inside external or third-party tools, the data team needs to extract the data from these tools, load the data into an analytical database (such as a data warehouse), and then transform the data to build data models – which finally power the reports that the growth team needs to derive insights from the data.
It’s worth noting that some third-party tools also offer the ability to capture events – either via an API or via webhooks – that can be directly sent to an event analytics tool for quick insights. However, a bulk of the data from external sources has to go through the ELT process (extract, load, transform) before the data is turned into insights.
From Insights To Growth
Here comes the final cut – this is it – this is the GDG model in its entirety:

Let’s take a closer look at what it takes to turn insights into growth.
From insights, there are two distinct paths to drive growth:
- Data Activation: Using insights to run reliable experiments in order to provide better end-user/customer experiences which may lead to growth
- Data Action: Using insights to make good decisions in order to build better products which may lead to growth
I’d like to highlight that Activation and Action are not the same – each is a separate activity that the growth team performs based on the insights they derive from the data.
More specifically, Activation is geared toward elevating the user experience across touchpoints whereas Action is geared toward offering more relevant and usable products.
The distinction here deserves more attention; therefore, I’d like to offer definitions and describe the processes to explain my point of view better.
Data Activation For Better Experiences
In simple terms, data activation is the end-to-end process of running data-powered campaigns and experiments to elevate the user/customer experience across touchpoints – with an aim to drive growth for the business.
This process of data activation can be further broken down into the following steps, assuming that a Good Data foundation is in place:
- The growth team has access to reliable insights about user behavior, enabling them to devise and set up more reliable campaigns and experiments.
- The team also has access to reliable data in the tools they use to run experiments and campaigns – the tools where data activation takes place.
- The objective of activating data is to offer a better experience to the end-user or the customer at a specific touchpoint, such as a timely in-app message nudging the user in the right direction. The outcome of that experience needs to be measured for the team to find out whether or not their efforts did indeed lead to a better experience. The insights also help them figure out what additional data they need to improve their data activation efforts.
- Finally, when the team is able to deliver a measurable outcome, such as more revenue or higher retention, that’s when growth takes place.
Data Action For Better Products
Once again, in simple terms, data action is the end-to-end process of making data-powered decisions and taking concrete steps to put those decisions into action to offer more relevant and usable products – with an aim to drive growth for the business.
With a Good Data foundation in place, the process of data action can be broken down into the following steps:
- The product/growth team has access to reliable insights about user behavior, enabling them to make good decisions.
- Once the relevant team has made a decision, such as to remove a feature or change the pricing plans, they have to involve other teams – engineering and potentially the executive team – to put their decision into action.
- Once the decision has been put into action and the expected change is live, the product/growth team that took the decision has to measure the outcome of the change to find out whether or not their efforts did indeed lead to a more relevant or usable product.
- Finally, when the team is able to deliver a measurable outcome, such as more revenue or higher retention, that’s when growth takes place.
It’s worth noting that even though Activation and Action are distinct paths, both can potentially lead to the same growth outcomes (more revenue or higher retention) and attributing the outcomes to one of the paths is rather challenging.
For instance, triggering an in-app guide based on a user’s past actions (data activation) and reducing friction by removing a feature altogether (action) are distinct activities that can both lead to higher retention; if both take place simultaneously, it’s hard to attribute the growth outcome to either one.
Moreover, in most organizations, the same team tends to own both Activation and Action workflows and in fact, it’s usually a combination of the two that turns data into growth.
The GDG Antithesis: Data To Frustration
Before wrapping up, I’d like to depict what happens when laying a foundation for Good Data starts with data collection.
When data is collected without any context or collaboration, the process appears quicker but in reality, it’s lengthy and circuitous, and leads to unwanted outcomes; it looks a lot like this:

This is the primary reason it takes months to set up data collection – it doesn’t have to be this way.
You might notice that the GDG model is a little opinionated as it lays down a specific path to get to Good Data. However, it’s important to keep in mind that the GDG model is not rigid and one should be able to tweak it to fit their organizational boundaries.
In fact, for certain types of data or use cases, it might make sense to initiate collection without defining metrics. Similarly, as a relatively new construct, contracts can be implemented in completely different ways or not implemented at all if the engineering team owns data engineering workloads.
That said, the outcome of data collection without proper context and collaboration is usually nothing but frustration for all the teams involved.
What to expect from the GDG book
Actually, let me first specify what not to expect: Tactics, Best Practices, Tooling Recommendations, and Growth Hacks.
The goal of this book is to simplify perceivably complicated concepts and terminology related to data infrastructure, help you ask better questions about data in the context of growth, and most importantly, offer a perspective on driving data-powered growth based on my own experience doing so at Integromat (now Make.com).
Chapter Map
While the book is an extension of the GDG model, chapters don’t necessarily mirror the order in which the components appear in the model. The first chapter sets the stage by offering an opinionated approach to laying a foundation for Good Data; it’s a short chapter and the only one that’s high on theory while the rest are rooted in first-hand stories.
Here’s a list of the chapters:
- Chapter 1: Context and Good Data
- Chapter 2: Burning Questions, Answered
- Chapter 3: Team Dynamics and Growth Mavericks
- Chapter 4: Deconstructing Data Modeling
- Chapter 5: Modeling Meaningful Metrics
I’m digging as deep as I can and sharing stories I’ve never shared before, and I look forward to taking you on this exploration.
Join me?

.svg)
.svg)

.svg)


