


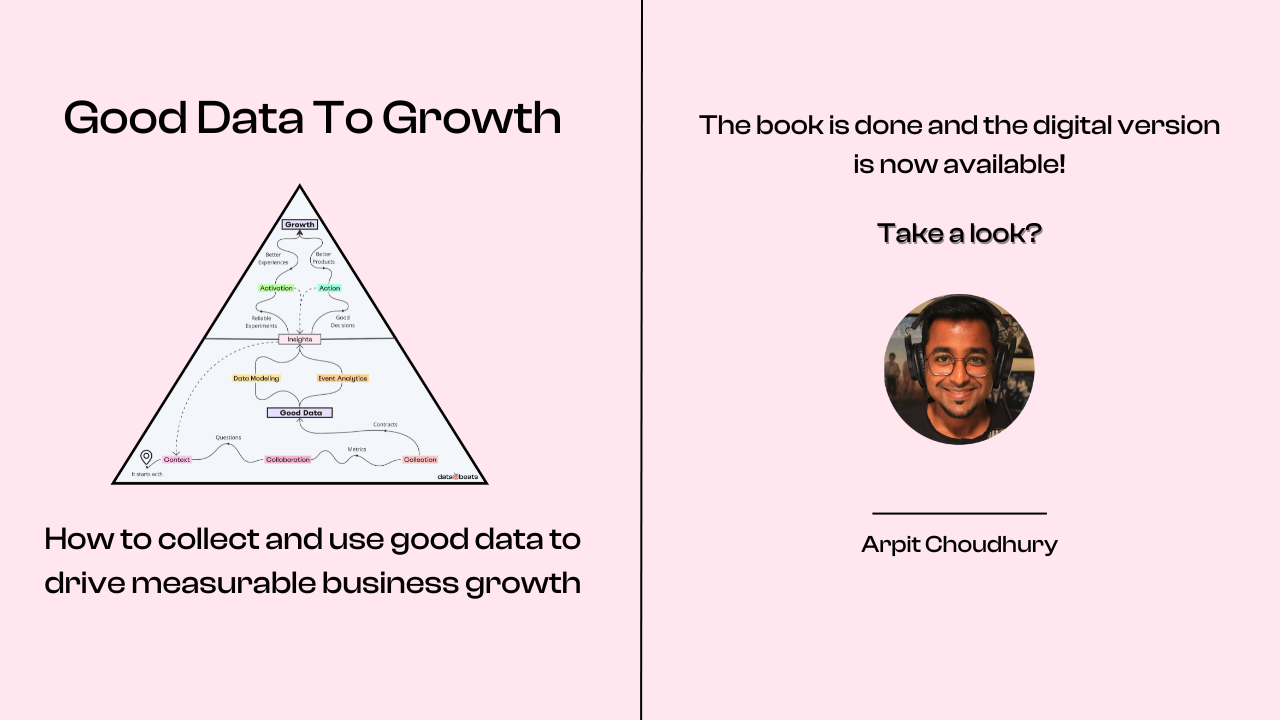
This is part 4 of a 5-part series titled Burning Questions, Answered. It also contains a short exercise at the end. Make sure to read part 3 before proceeding.
{{line}}
As a reminder, external or third-party tools and APIs used for messaging, support, feedback, authentication, payments, etc. that users interact with as part of the product experience are external data sources.
Growth-obsessed individuals thrive on experiments because they understand that driving growth is not just about big bold moves; it’s about testing, iterating, failing, learning, and making incremental improvements that lead to predictable, measurable, and sustainable growth. And to run experiments successfully, all they need is for the requisite data to be made available in the right shape in the right tools.
At Integromat, thankfully, we got there sooner rather than later – with data from our app being synced in near real-time to our activation tools, Userflow and Customer.io. The insights from the Mixpanel reports made it evident that to increase the activation rate, we need to walk new users through the process of creating their first scenario on Integromat (via in-app tours) and at the same time, bring users of inactivated accounts back into the app (via lifecycle emails).
As I’ve often mentioned, Integromat had a relatively steep learning curve and the process of creating a scenario involved many steps, leading to a couple of very detailed in-app product tours (created using Userflow) that were embedded in the core product experience. At the start of the onboarding process, users were prompted to choose their preferred email provider and based on their choice, they entered one of the product tours. Moreover, since there were external dependencies (a user had to connect external services that they wanted to use in their Integromat scenarios) while building the tours, we had to account for potential errors that a user might encounter; therefore, we spent a lot of time building and testing the guides (and offering error-handling tips) – all of which ultimately led to the following burning question:
“We have improved the onboarding experience with detailed product tours to get more users to hit the activation milestone; how do we measure the impact of the product tours on our activation rate?”
In other words, how do we establish causality between the newly embedded product tours and a higher activation rate?
A higher activation rate couldn’t automatically be attributed to the new and improved onboarding; it would be foolish to assume that a product tour was effective without measuring how it impacted activation – without figuring out whether the users who hit the activation milestone after completing the tour outnumbered those who dismissed the tour but created (and tested) a scenario nonetheless; or was it the other way around (more users dismissed the tour and became activated than those who completed the tour), indicating that the product tour had a negative impact on the activation rate.
Moreover, an increase in the activation rate could very well be caused by some other factor, such as the marketing team’s efforts to acquire more relevant users. Therefore, we had to go beyond measuring the performance of our experiments – to measure how the experiments impacted the metrics that matter the most. If we only looked at the completion rate of a product tour and kept iterating it to increase the completion rate, we’d be stuck measuring the performance of that product tour rather than measuring its impact on the activation rate – the metric that mattered the most for this experiment.
Therefore, it was a priority to figure out the most efficient way to collect events pertaining to the product tours (that originated in Userflow) and send them to Mixpanel to see whether or not the tours were driving more users to the activation milestone. When I brought this up to Sebastian, the Userflow founder, within a matter of days, he shipped an integration that sent Userflow-generated events to Mixpanel, and with a few clicks, I got what I needed to answer my burning question!
I built a series of funnel reports comprising events from Userflow and events from our app, leading to much-needed insights from our in-app experiment. For instance, I could easily calculate and compare the following metrics for any given period:
- Accounts where a scenario was created as a result of the product tour being completed
- Accounts where a scenario was created even though the product tour was left incomplete
- Accounts where a scenario was created even though the product tour was not started
Userflow’s readymade integration with Mixpanel made this quick and easy. If we were to conduct the same analysis outside of Mixpanel, we’d have to use an ETL tool to ingest the data into a data warehouse, write SQL queries to build data models for each of the above metrics (such as a model that would check if a user completed the product tour before saving their first scenario on Integromat), and then use the models to create reports in a BI tool – a more expensive process that would take longer to implement ( we’ll be paying for the ETL jobs, storage, compute, and most importantly, for people’s time spent building the models).

This use case, I believe, nicely illustrates the importance of looking for the fastest and easiest way to implement a use case, especially one that involves data from external sources. In fact, in this particular example, using the readymade integration was quite economical as it only increased our Mixpanel consumption (and we had a good deal from them). At the end of the day, a growth-obsessed individual’s primary concern is to get fast answers to their burning questions so that they can drive incremental improvements to the product experience; therefore, for one to know the most efficient way to collect the data and make it usable in the requisite destination(s) goes a long way.
Another burning question
Now, let’s look at yet another burning question:
“We’re running a series of email campaigns to drive users of inactivated accounts back into the app; how do we find out if users who open at least one email in the campaign come back to perform the actions leading to activation? And how do we compare the results of that cohort with the one where users become activated without opening a single email in the campaign?”
Once again, the goal was to establish a causal relationship between the email campaigns and a higher activation rate. However, doing so turned out to be more complicated than I’d anticipated, and because we had limited resources, we had to deprioritize this use case and my burning question went unanswered. Let me explain why this was the case (in 2019) and what has changed since then.
On Customer.io, users would enter a campaign when they entered a predefined segment and exit the campaign when they match the conversion criteria (the criteria were also specified as users entering a segment on Customer.io). At the time, Customer.io didn’t support event-based goals (which they do now) and that led to false positives because technically, a user could enter another segment (after performing certain actions) and thereby exit a campaign – without receiving a single email from that campaign. It was, in fact, impossible to accurately measure conversions on Customer.io itself.
Here’s what I wanted to establish to measure the impact of our email campaigns:
A user who entered a campaign on Customer.io opened at least one email in the campaign, found the content valuable, and therefore clicked a link in the email to go back into the app and perform the event that matches the campaign goal.
Today, it is possible to establish the above directly on Customer.io as one can specify very granular conversion criteria but back then, we had two options:
- Setup a webhook on Customer.io to send the email_clicked event to Mixpanel via Mixpanel’s API (at the time, there was no readymade integration between the two; Customer.io has built one since) and create funnel reports, similar to the ones we created using Userflow-generated events. We didn’t go ahead with this because by doing so, we’d be sending over a thousand additional events to Mixpanel every day and hit our event quota very quickly.
- Import the data from Customer.io into Snowflake and create a model that would check if a user clicked one of the emails from any of the campaigns before hitting the activation milestone on Integromat. This was on the roadmap but didn’t get prioritized because we were in the early days of setting up Snowflake with the help of our sole data generalist – he had been hired recently and as you’d expect, had too much on his plate already.
I’m glad that tools like Customer.io have built better reporting capabilities, doing away with the need to ETL data into a warehouse and build data models (and pay for additional storage and compute). That said, it’s worth mentioning that using a data warehouse unlocks more intricate use cases, especially the ones that cannot be solved using readymade integrations or webhooks.
For instance, I wanted a user to exit all email campaigns on Customer.io if they had an open support ticket on Zendesk – I didn’t want users to receive an email asking them to go back and do something in the app while they waited for an issue to be resolved. Implementing this use case was (and as far as I know, still is) only possible by bringing data from Zendesk into a warehouse, creating a model that runs a check (on a predefined interval) if a user has at least one support ticket open and if they do, update a property on Customer.io (that is used in the exit criteria for all campaigns).
Pause to ponder 🤔
Think about a burning question you’re trying to answer and consider the following:
- Do you have a good idea about the data needed to answer your question?
- Do you know where the data originates?
- Do you also know where you need the data to be sent for consumption?
Conduct this exercise 🏋️
Go inside your email engagement tool and check the following:
- Does every campaign contain the conversion criteria (goal)?
- Can you specify event-based goals? And can you account for email opens and clicks in the goal criteria?
- What is the level of granularity of your campaign goals? Can you fine-tune them to avoid false positives?
{{line}}
Move on to the final part of the series that helps answer, "Where will the data be consumed?"

.svg)
.svg)

.svg)


